A Kubernetes incident often starts with a broad symptom: requests fail, a rollout stalls, or CPU looks wrong. The fastest useful response is to turn that symptom into a sequence of observations. Capture what is happening before a restart removes the evidence, then test one explanation at a time.
Visual reference / AWS delivery
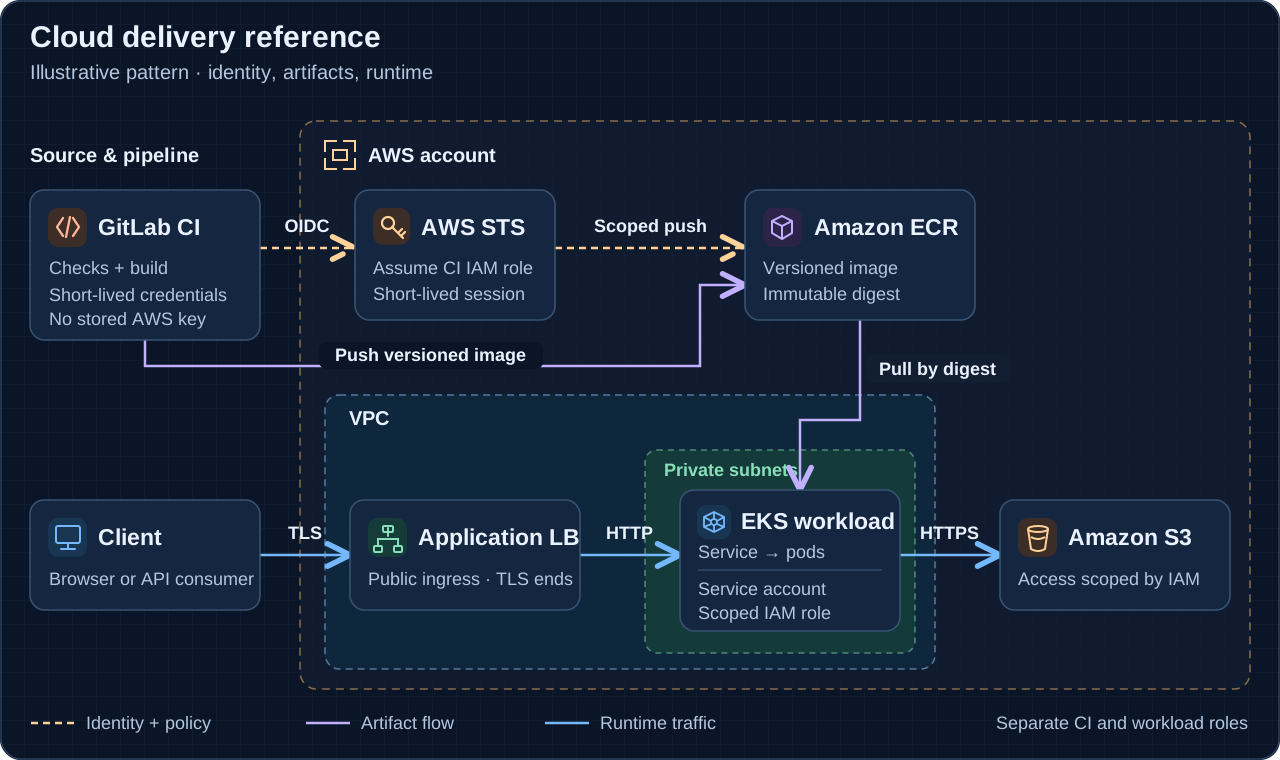
- Delivery identity
GitLab CI exchanges its OIDC token for a scoped AWS role. The trust policy defines which jobs may assume it.
- Artifact identity
The pipeline publishes an image to ECR. An image digest identifies the bytes selected for deployment.
- Runtime boundary
HTTPS traffic enters through an application load balancer and reaches the application in an EKS workload boundary.
- Workload identity
The application uses its own scoped AWS identity for S3 access. Its permissions are separate from the pipeline’s role.
The examples below use a fictional web Deployment and Pod in the apps namespace. Replace those names with the actual objects. The commands are investigation examples; they are not evidence that any particular cluster is healthy.
Confirm the target and the time window
Start by identifying the cluster context, namespace, workload revision, and affected time range. A correct command against the wrong context creates convincing but irrelevant evidence. Record the Pod UID and container restart count when an object may have been replaced.
kubectl config current-context
kubectl get deployment web -n apps
kubectl get pods -n apps -l app=web -o wide
kubectl describe pod POD_NAME -n apps
The Pod description provides status, container state, and recent events. Use it to distinguish a scheduling problem from an image pull problem, a process failure, or a probe failure. A Pending Pod and a repeatedly restarting container require different next steps. Kubernetes’ Pod debugging guide is a useful reference for that first separation.
Read the process evidence
Collect logs for the specific container and a bounded interval. If the container restarted, inspect its previous instance when that log is still available. Preserve the relevant output with a timestamp before changing configuration.
kubectl logs POD_NAME -n apps -c web --since=15m
kubectl logs POD_NAME -n apps -c web --previous
kubectl get pod POD_NAME -n apps -o yaml
Logs describe what the process reported. They do not by themselves show that traffic reached the correct Service, that every replica behaved the same way, or that a downstream response arrived. Kubernetes also separates container logging from durable cluster-level log storage. Plan retention accordingly; the logging architecture documentation explains that distinction.
Treat readiness and liveness as different signals
A running process may not be ready to serve requests. A readiness failure removes a Pod from normal matching Service traffic without requiring a process restart. Liveness failures can trigger restarts. Startup probes provide a separate startup allowance before the other probes begin.
Read the configured endpoint, port, timeout, and thresholds before changing them. An overloaded dependency should not casually become a reason to restart every application replica. Probes are application behavior expressed as policy; tune them to the failure each should detect. See the probe documentation.
Follow a request through the Service
Check selectors and EndpointSlices before assuming that application code is receiving requests. Then compare Service ports, target ports, and the address on which the process actually listens. A ready Pod with an unexpected label can be healthy and still receive no traffic from the intended Service.
kubectl get service web -n apps -o yaml
kubectl get endpointslices -n apps   -l kubernetes.io/service-name=web
kubectl get pods -n apps --show-labels
When testing from inside the cluster, choose a caller that represents the real path and has appropriate network access. A successful direct Pod request does not establish that DNS, the Service path, ingress, and external TLS all work. The Service debugging guide walks through these boundaries.
Read resource numbers in context
Requests guide scheduling; they are not current consumption measurements. A container can use more than its request when resources are available. CPU limits can lead to throttling, while memory pressure and memory limits can lead to OOM termination. Check actual usage, limit configuration, and the last termination reason together.
Keep units and time windows explicit. CPU cores, millicores, and a percentage of a chosen denominator are different representations. An average across replicas also answers a different question from a peak on one container. The resource management documentation defines the request and limit behavior.
Verify the change at the same boundary
Once evidence supports a change, make the smallest useful intervention and repeat the checks that exposed the failure. Observe the rollout, confirm ready replicas, and exercise the affected request path. kubectl rollout status reports controller progress; a real application check still needs to verify the behavior users depend on.
Save the relevant release identity and recovery path with the incident notes. A restart that temporarily clears symptoms and a verified correction are different outcomes. Clear observations make that difference visible to the next person investigating the system. Kubernetes documents rollout behavior in its Deployment reference.
Source documentation
Primary references for the concepts and examples in this note.

DevOps, infrastructure automation, and clear paths from an idea to an operable system.
Connect on LinkedIn